 In this and upcoming articles, we want to give you an idea of the actual forces that are put on M/A systems versus theoretical forces that you may read about. What’s the difference?
With theoretical, we’re referring to the amount of force that is “supposed” to be produced, while the actual is just that…the actual amount of force that is produced when the system is built and operated.
For example, calculating the force if you built a 3:1 mechanical advantage “on paper” (theoretically) versus physically building the system. With the actual system, you would have to consider the friction loss created by the system components, so the “actual M/A” may be 2.5:1 with the same 3:1 system.
Test #1: Straight-line Pull
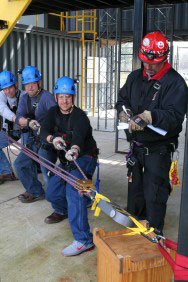
Student Set-up: Students were asked to pull on the line in a horizontal plane and exhibit as much force as they could without tugging/jerking the line. They were then asked to maintain that tension and tug/jerk the line.Equipment Set-up: 12-ft of 1⁄2” PMI rope tied with a Figure 8 knot and attached to the dynamometer by two 2-ft pieces of 1” basket-looped webbing and two auto-locking steel carabiners to a rigid anchor with another basket-looped webbing loop.
What the Numbers Mean
First of all, they will serve as a baseline for future informal tests when comparing different types of M/A systems. We will evaluate the efficiency of the different systems as well as the possible forces that are put on the components of the system when using typical rescue haul teams.Grasping at Ropes
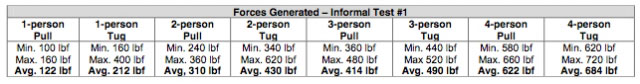
 One interesting fact that we can take away from these numbers is that even though the vast majority of the persons involved in the testing (random rescue students) weighedin excess of 160 lbs, they were only able to generate a maximum of 160 pounds of force on the 1⁄2-inch rope. This is largely due to the student’s ability to grasp and hold onto the 1⁄2” line before it pulled through their hands.
Similar tests using 9mm rope had an average force of 120 lbf for a single-person pull. There was only a slight difference of about 2 lbf between the 1⁄2-inch rope and the 9mm rope. We had anticipated a greater disparity as the rope diameter decreased and the ability to grasp the smaller line was lessened. However, we did observe that with the smaller diameter rope, haulers had a tendency to twist their hands making a 90-degree turn in the rope. This added additional friction making it possible to put more force on the line before it slipped.
Stay tuned as we continue this informal, real-world testing in future blog posts. It should be interesting to see how the forces translate from 1,2,3, and 4-person Haul Teams when using these various Mechanical Advantage systems.